0:00
Hi everyone and welcome back to Excel
0:03
Wiz. In today's video, I'm going to show
0:05
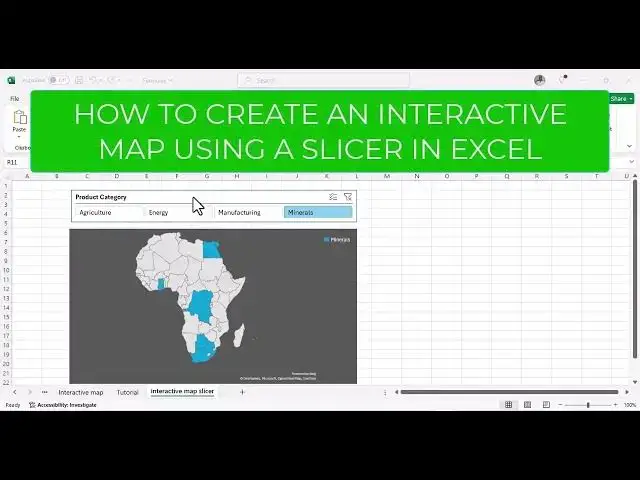
you how you can create an interactive
0:08
map in Excel using just a simple slicer
0:11
just like the map we have here. If you
0:13
click on agriculture, you see uh you've
0:17
got minerals in all these countries.
0:19
When you click to energy, the map
0:21
changes to the different countries that
0:24
export energy. When you click on
0:27
manufacturing, it goes to different
0:29
countries. And when you click on
0:31
minerals, you also get to see all the
0:34
countries that have it. If you want to
0:37
clear, you just click on this and it
0:39
goes back to all the sectors. So, if
0:42
you'd like to know how to do this kind
0:44
of map, please stick around and I'll
0:46
show you how to do it.
0:51
So to start we have this raw data of
0:54
regions, country, product category, the
0:56
export product, the value in uh US
0:59
dollars, the year and the primary
1:01
trading partner. The first step we are
1:04
going to convert our data into a table.
1:07
Just select the all uh the data that
1:12
Uh on the insert tab, click on insert
1:18
This is what the data that you need.
1:19
Click on okay. So once you have this uh
1:22
table please just click on any cell any
1:26
cell and once you do that uh table
1:29
design is going to appear on the top.
1:32
Click on the table design and the table
1:35
design click on insert slicer. Once you
1:38
insert slicer please select the what you
1:43
need to use. So in this uh I want to use
1:46
region. We are going to we are going to
1:49
use our slicer that has regions. So
1:52
click on okay. Once that's done you can
1:56
choose to have it uh this way or just um
2:00
put them in columns. So under slicer
2:05
over the buttons click on columns and
2:08
count your regions. 1 2 3 4 5. We have
2:11
five regions. So we need five columns.
2:13
So increase your columns to five and
2:16
then adjust your slicer to fit uh your
2:22
And there we go. Here we have our
2:24
slicer. We can move it all the way down
2:29
Ah, there we go. So next thing to do,
2:32
let's now insert our map. So
2:37
select your data once more. So this will
2:40
be the data included in our map.
2:43
So once you have your data selected, go
2:51
click on maps and click on field maps.
2:57
You can choose a background of your
2:59
liking. Let's go with the gray
3:01
background. And then we can now choose
3:04
to move our ch uh our map all the way
3:08
down here. Adjust it accordingly.
3:17
alternative for a better experience.
3:20
Let's we for a better experience. Let's
3:24
just uh copy all this. We can copy all
3:34
We need to select both the slicer and
3:36
our map. So, we'll do that.
3:46
So move to another worksheet and paste
3:53
We need to paste everything as it is
3:56
using uh including the map.
4:06
And as as you can see, we've got
4:09
everything pasted here. So, click on uh
4:13
let's adjust this so we can read it
4:19
Adjust it accordingly.
4:22
So, Mhm. Let's do the map once more.
4:30
So if you want to see the data in
4:33
central Africa, click on central Africa
4:36
and your map moves accordingly. If you
4:39
want uh the products from East Africa,
4:44
it's in East Africa you get agriculture
4:47
and manufacturing. If you go to North
4:50
Africa, the map switches to North Africa
4:52
and you get the products that are there.
4:56
South Africa, minerals and agriculture.
5:00
And then when you click on West Africa,
5:02
you get energy, agriculture and
5:05
You can click your chart to
5:08
to adjust it. So let's see. For example,
5:11
you want to get rid of the um title,
5:15
chart title. You can click on it or it
5:18
disappears and you just get the map. You
5:20
can include the data labels to be
5:22
included in your map. That's if you
5:24
want. But that's how now you get to
5:28
create an interactive map in Excel using
5:30
a slicer. So if you have any questions,
5:33
please feel free to leave them down in
5:36
our comment section. And if you want us
5:38
to make an video, please let us know.
5:41
And as always, thank you very much for
5:43
watching and see you again in the next