
Sometimes you may work with large worksheets containing very detailed information. Such worksheets may be hard to read, analyze or visualize therefore calling out the need to organize your worksheet. In Excel, this is possible as you can organize your data by combining subcategory data. You can group rows to enable one to easily understand Excel reports, as the various unwanted numbers of rows will be hidden.
Here, we guide you on how to group rows in Excel under a heading.
Steps to follow to group rows automatically
Follow these steps when you want to group your worksheet rows if the data contains only one information level. Here is what to do:
1. Select a cell or range
2. Click on the Data window on the main menu ribbon.
3. Under the Outline group, click on the drop-down arrow on the Group
4. Click the option Auto Outline

Group rows by using the keyboard shortcut key
You can also group your Excel data under a heading using a keyboard shortcut.
Here, you will press Shift ,Alt plus Right Key to group your data.
Before doing this, you will select the rows that need to be grouped.
To expand or collapse the outlined data, use the plus (+) or (-) outline symbols. Apart from this, you can use the keyboard shortcut Alt + Shift + = to expand your grouped data or Alt + Shift + – to collapse your rows

Note:
With the method above, you will need to each row of data individually rather than collectively like the method above.
Grouping data together manually in Excel
Incase Excel worksheet contains a lot of information levels, you may find that Auto Outline doesn’t classify the data the right way. Here, you can group your data manually by following these steps:
1. In an open Excel, go to the worksheet that contains the data you want to group.
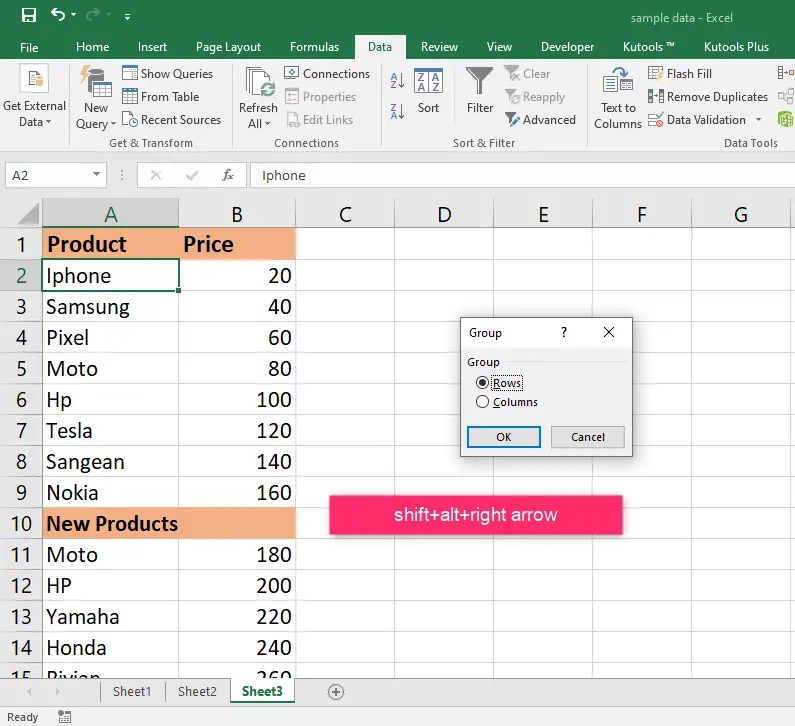
2. Select the rows that you want to group.
3. Click on the Data window on the main menu.
4. Under the Outline , click on the Group

5. In the pop-up window that opens up, select the Rows option to group your data by rows.
6. Click OK. Afterward, you will notice your data has been grouped. A bar will be added on the left side of your worksheet, spanning the selected rows.
Note:
When you create an outline manually, you first have to ensure that your dataset does not contain any hidden rows to avoid incorrect grouping.
Group Excel by Rows using VBA code
1. Press Alt + F11 to open the VBA editor in Excel. (Alternatively, you can launch the VBA editor on both Windows and Mac by clicking on the developer tab and then select Visual Basic. )
2. click on Insert then Select Module
3. Copy and paste the code below into the module.
Sub GroupRows()
    Dim ws As Worksheet
    Dim startRow As Long
    Dim endRow As Long

    ' Set the worksheet object
    Set ws = ThisWorkbook.ActiveSheet

    ' Set the range of rows to group
    startRow = 2 ' Modify the start row as per your requirement
    endRow = 10 ' Modify the end row as per your requirement

    ' Group rows
    ws.Rows(startRow & ":" & endRow).Group
End Sub
4. Modify the startRow and endRow variables to define your desired row range.
5. Press F5 to run the code, or close the VBA editor and run the macro from the Excel interface.
Similar Reads
How to Link Sheets in Excel: 4 Easy Methods
How to Make Excel File Smaller: 8 Simple Methods
Discover more from Excel Wizard
Subscribe to get the latest posts sent to your email.